How well is Argo able to observe the global ocean?
A key objective of Argo is to observe ocean signals related to climate change. This includes regional and global changes in ocean temperature and heat content, salinity and freshwater content, the steric height of the sea surface in relation to total sea level, and large-scale ocean circulation.
Argo’s global span is transforming our capability to observe climate-related changes. Seasonal and interannual variability dominate the upper ~600 m of the ocean, but temperature anomalies down to 1900 m show a consistent warming trend. There is now a 15+ year time series of good global coverage, capturing decadal trends in ocean heat content and year to year variability. At the moment, the Argo array only samples to 2000 meters leaving the deeper half of the ocean under observed by Argo. Deep Argo floats, however, that can measure all the way down to 6000 meters are now being deployed in pilot study areas to help answer questions about deep ocean warming.
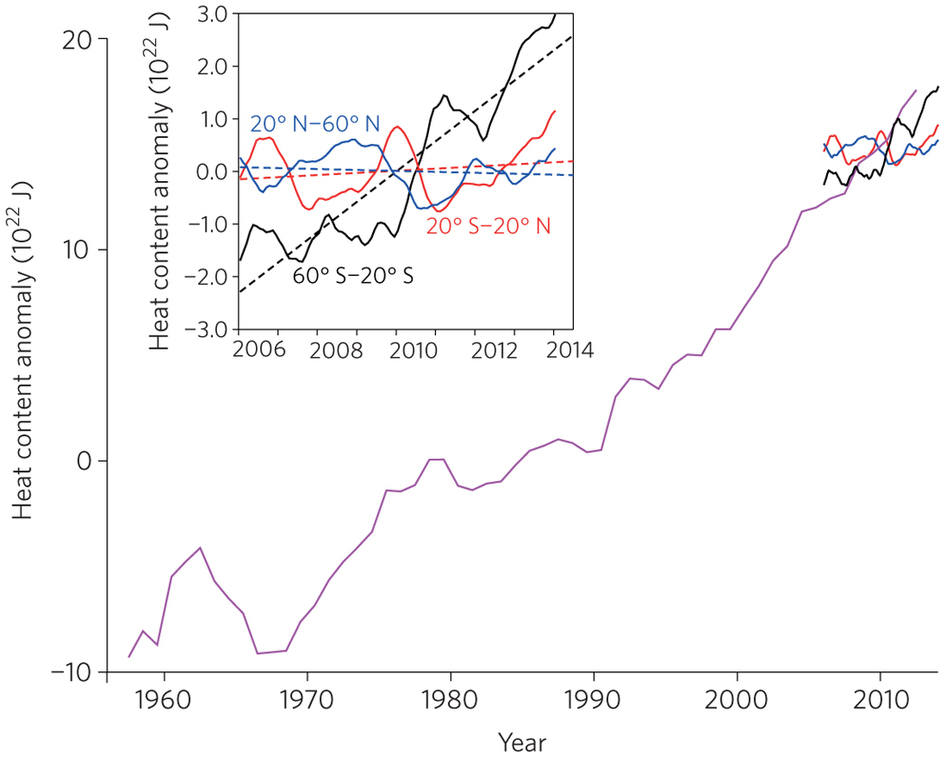
Estimates of the heat content anomaly for 60°S – 20°S (black), 20°S – 20° N (red) and 20°N – 60°N (blue), and a global estimate (purple). Regression lines (dashed) are shown in the inset.
Used with permission from Riser, S.C., H.J. Freeland, D. Roemmich, et al, 2016: Fifteen years of ocean observations with the global Argo array. Nature Clim. Change, 6, 145-153, http://dx.doi.org/10.1038/nclimate2872
Global coverage is essential, but for global change applications, Argo data must also have high accuracy and minimal systematic errors. Therefore, a high priority for Argo is to continue work aimed at identifying and correcting measurement errors, especially those with systematic impacts. Argo still relies on the availability of high quality shipboard CTD transects from GO-SHIP and other hydrographic programs. Argo has contributed to improving our understanding of the following four topics on a global scale:
- ocean temperature and heat content
- ocean salinity and freshwater content
- steric sea level
- ocean circulation
Ocean temperature and heat content
Over the past 50 years, the oceans have absorbed more than 80% of the total heat added to the air/sea/land/cyrosphere climate system (Levitus et al, 2005). As the dominant reservoir for heat, the oceans are critical for measuring the radiation imbalance of the planet and the surface layer of the oceans plays the role of thermostat and heat source/sink for the lower atmosphere.
Levitus et al (2012), Domingues et al (2008) and Levitus et al (2009) previously, have estimated the multi-decadal upper ocean heat content using best-known corrections to systematic errors in the fall rate of expendable bathythermographs (Wijffels et al, 2008). For the upper 700m, the increase in heat content was 24 x 1022 J (±2.S.E.) since 1955. This is consistent with the comparison by Roemmich and Gilson (2009) of Argo data with the global temperature time-series of Levitus et al (2005), finding a warming of the 0 – 2000 m ocean by 0.06°C since the (pre-XBT) early 1960’s.
Each year, the Bulletin of the American Meteorological Society puts out a publication on the state of the climate. Now included is an update on ocean heat content and ocean temperature in the upper ocean. The top panel shows the ocean heat content anomaly in the top 700m using five different data sources, all of which use Argo data. The second half of the top panel shows the ocean heat content anomaly for the deeper ocean based on repeat hydrography. The second panel shows the temperature anomaly for the upper 2000 m of the ocean using the RG Argo Climatology (http://sio-argo.ucsd.edu/RG_Climatology.html).
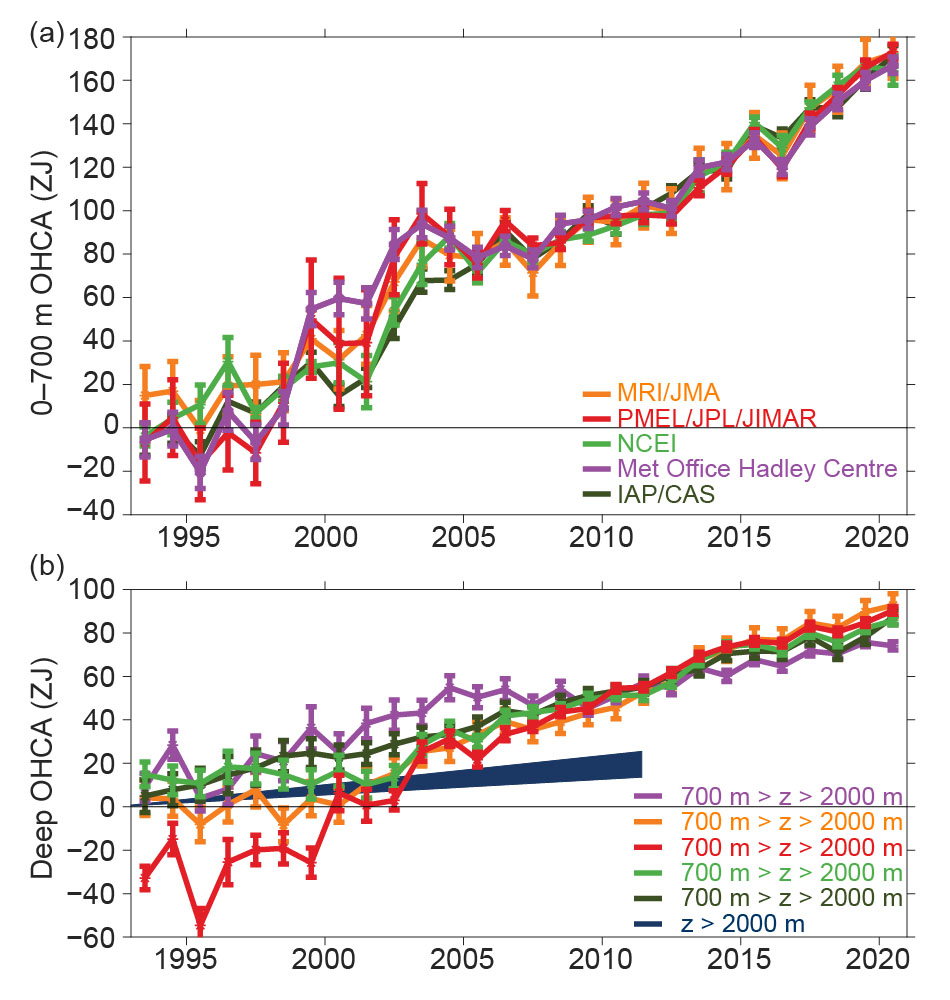
Fig. 3.6. (a) Annual average global integrals of in situ
estimates of upper (0–700 m) OHCA (ZJ; 1 ZJ = 1021 J)
for 1993–2020 with standard errors of the mean. The
MRI/JMA estimate is an update of Ishii et al. (2017). The
PMEL /JPL /JIMAR estimate is an update and refinement
of Lyman and Johnson (2014). The NCEI estimate follows
Levitus et al. (2012). The Met Office Hadley Centre estimate
is computed from gridded monthly temperature
anomalies (relative to 1950–2019) following Palmer et
al. (2007). The IAP/CAS estimate is reported in Cheng
et al. (2020). See Johnson et al. (2014) for details on
uncertainties, methods, and datasets. For comparison,
all estimates have been individually offset (vertically on
the plot), first to their individual 2005–20 means (the
best sampled time period), and then to their collective
1993 mean. (b) Annual average global integrals of in situ
estimates of intermediate (700–2000 m) OHCA for 1993–
2020 with standard errors of the mean, and a long-term
trend with one standard error uncertainty shown from
1992.4–2011.6 for deep and abyssal (z > 2000 m) OHCA
following Purkey and Johnson (2010) but updated using
all repeat hydrographic section data available from
https://cchdo.ucsd.edu/ as of Jan 2021.
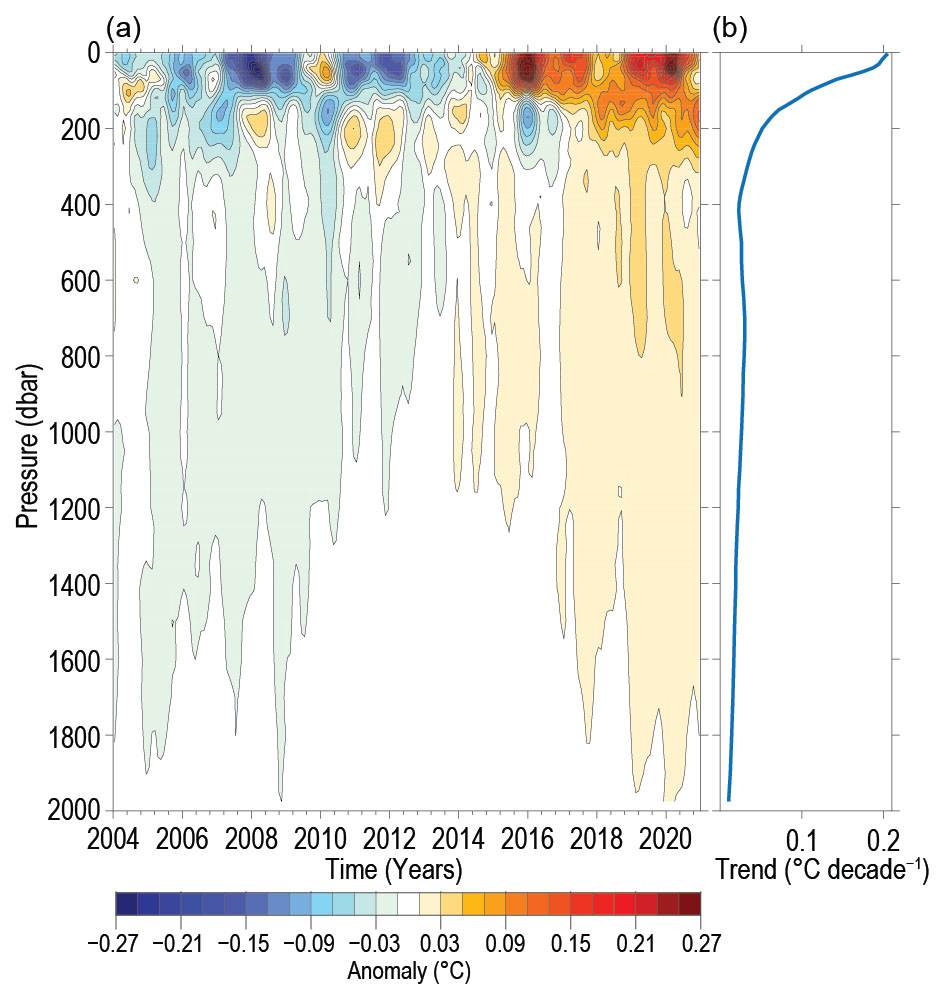
Fig. 3.5. (a) Near-global (65°S–80°N, excluding continental shelves,
the Indonesian seas, and the Sea of Okhostk) average monthly
ocean temperature anomalies (°C; updated from Roemmich and
Gilson [2009]) relative to record-length average monthly values,
smoothed with a 5-month Hanning filter and contoured at odd
0.02°C intervals (see colorbar) versus pressure and time. (b) Linear
trend of temperature anomalies over time for the length of the
record in (a) plotted versus pressure in °C decade−1 (blue line).
Ocean salinity and freshwater content
Among the major societal impacts of climate change is an increase in the global cycle of evaporation and rainfall caused by a warmer ocean surface layer. Changes in the patterns and magnitude of rainfall and storms affect nearly every facet of society, from agriculture and urban water supplies to disease and health, to housing, transportation and insurance impacts of severe weather. While the impacts are local and regional, the causes and patterns are global.
Regionally, the ocean becomes fresher or saltier where the balance between evaporation minus rainfall tips in one direction or the other over time. As an integrating measurement made with high accuracy, freshwater content (salinity anomaly over a layer) is the most sensitive yardstick available for observing the global fingerprint of a changing hydrological cycle. A second application of salinity is to diagnose the global volume of ice. Melting of either floating ice or glaciers and ice sheets lowers ocean salinity.
Recent analysis of Argo data in relation to the historical record show an increase in salinity in evaporative mid-latitude regions and a freshening at high latitudes and tropical convergence zones. This pattern may imply an increase in the global hydrological cycle by several percent (Johnson et al, 2014, Durack et al, 2012, Helm et al, 2010, Hosoda et al, 2009, Johnson and Lyman, 2008).
As with heat content and temperature, the yearly state of the climate from the Bulletin of the American Meteorological Society includes an update on global sea surface salinity (SSS) anomalies and changes in recent years based on Argo data. While Argo data deliveries salinities at depth as well as the surface, it is also a source of surface data that is delivered year round without bias and is of high quality. The top figure in the panel below shows the SSS anomalies in the world ocean in 2020. The middle panel shows the difference between 2020 and 2019. The final figure shows the difference as compared to the annual average from 2005 – 2020 (2005 is when Argo had sufficient global coverage). The areas that are colored only without grey dots are the areas where there is significant difference from the average. It is possible to see the freshening of the northeast Atlantic Ocean and the increasing saltiness of many sections of the ocean in the southern hemisphere.
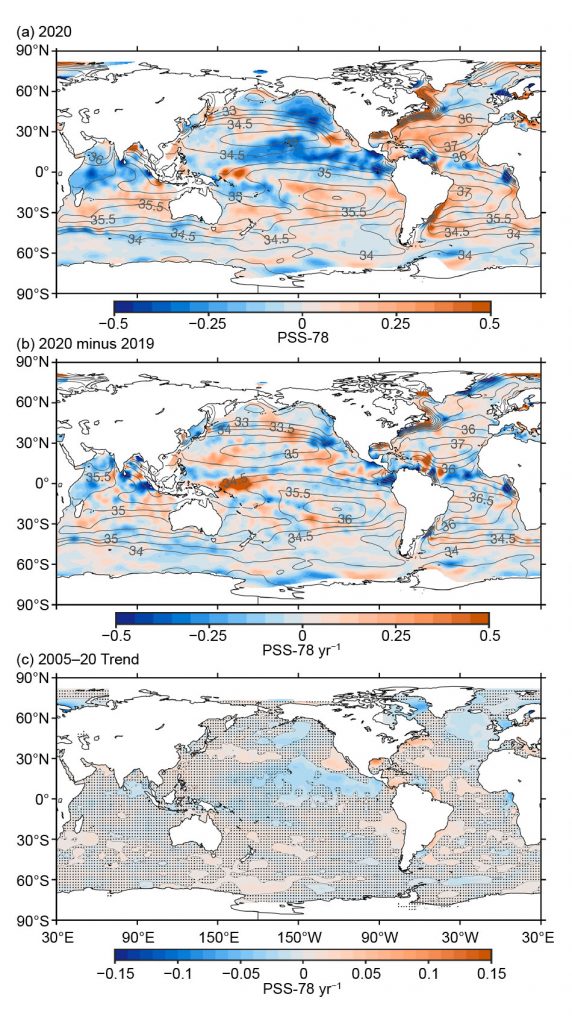
Fig. 3.7. (a) Map of the 2020 annual surface salinity anomaly (colors,
PSS-78) with respect to monthly climatological 1955–2012 salinity
fields from WOA13v2 (yearly average—gray contours at 0.5
intervals, PSS-78). (b) Difference of 2020 and 2019 surface salinity
maps (colors, PSS-78 yr–1). White ocean areas are too data-poor
(retaining <80% of a large-scale signal) to map. (c) Map of local
linear trends estimated from annual surface salinity anomalies for
2005–20 (colors, PSS-78 yr–1). Areas with statistically insignificant
trends at 5%–95% confidence are stippled. All maps are made
using Argo data.
Steric sea level
Steric sea level provides a great example of Argo’s complementary relationship with other observing system elements, particularly the altimeter Jason. Argo provides the capability to understand sea level change by measuring the change in water volume due to a warming ocean. The steric component is dominant over the mass component in regional sea level variability and on a global basis it accounts for about 1/3 of total sea level increase in the past half century (Domingues et al 2008). Accurate projections of future sea level require an understanding of the causes of sea level change in the modern record.
On seasonal and longer time-scales, sea surface height is dominated by changes in subsurface density. Thus, by measuring temperature and salinity as a function of depth, Argo reveals not only how much of sea surface height variability is steric in origin, but also how the steric signal is distributed over depth and between temperature and salinity. Combining sea surface height measurements from the Jason altimeter and Argo’s ability to see below the ocean surface, climate related basin-scale signals on interannual and decadal timescales, such as a 15-year spin-up of the South Pacific gyre described by Roemmich et al, 2007 are becoming apparent. On global scales, Argo and Jason, together with satellite gravity measurements, partition global sea level rise into its steric and mass-related components (Ablain et al, 2015, Dieng et al, 2015, Llovel et al, 2014, Leuliette and Willis, 2011, Willis et al, 2008, Cazenave et al, 2009, Leuliette and Miller, 2009, Wunsch et al, 2007).
As with heat content, temperature and salinity, the yearly state of the climate from the Bulletin of the American Meteorological Society includes an update on global sea level rise as seen in the panel below. The red line below shows the mean steric sea level as measured by Argo. The black line is the total sea level and the darker blue is the mass sea level as measured by GRACE. The steric and mass contributions added together are the purple line which agree very well with the total sea level rise as measured by satellite altimetry.

Fig. 3.15. (a) Monthly averaged GMSL (mm) observed by satellite
altimeters (black, 1993–2020 from the NOAA Laboratory for Satellite
Altimetry), global ocean mass (blue, 2005–20 from GRACE and
GRACE-FO), global mean steric sea level (red, 2004–20 from the
Argo profiling float array), mass plus steric (purple), and inferred
global ocean mass (blue) calculated by subtracting global mean
steric sea level from global mean sea level. All time series have
been smoothed with a 3-month filter.
Ocean circulation
The oceans are not only reservoirs for heat and water in the climate system. They are dynamically active, redistributing heat and water by means of an ocean circulation that responds to changes in wind and thermohaline forcing. Argo presently observes only the interior upper-ocean circulation, so a complete observing system that includes boundary currents and deep measurements is essential for understanding the entire ocean circulation. Some recent papers describing upper-ocean circulation include Roemmich et al’s (2007) paper on Argo contributing to estimating changes in gyre-scale circulation, Gille’s (2008) paper on the Antarctic Circumpolar Current and McCarthy’s (2015) paper on the Atlantic meridional overturning circulation. Ollitrault’s creation of the ANDRO Atlas (Ollitrault and de Verdiere, 2014) uses Argo trajectory files to calculate 600,000+ deep displacements which can be used to calculate deep velocities. The figure below shows the mean zonal (east-west) velocity at the drift depth of Argo floats (950-1150 dbars) based on the ANDRO Atlas.
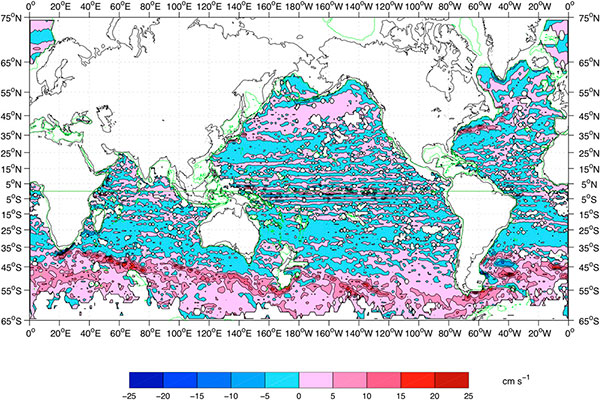
Figure 10: Mean zonal velocity in the layer 950-1150 dbar with a minimum of 30 float days within each 150-km-diameter disk.
Ollitrault, M. and A. Colin de Verdière, 2014: The Ocean General Circulation near 1000-m Depth. Journal of Physical Oceanography, 44, 384-409, http://dx.doi.org/10.1175/JPO-D-13-030.1
