With close to 4000 floats reporting free, easy to access data every 10 days, Argo provides a relevant, global ocean data set. The temperature, salinity and velocity data from Argo can teach everything from basic concepts, like the temperature of the ocean and how to read graphs, to more complicated ones like analyzing ocean data over time and climate change issues. Given the broad range of possible audiences for learning about Argo, several different approaches have been taken.
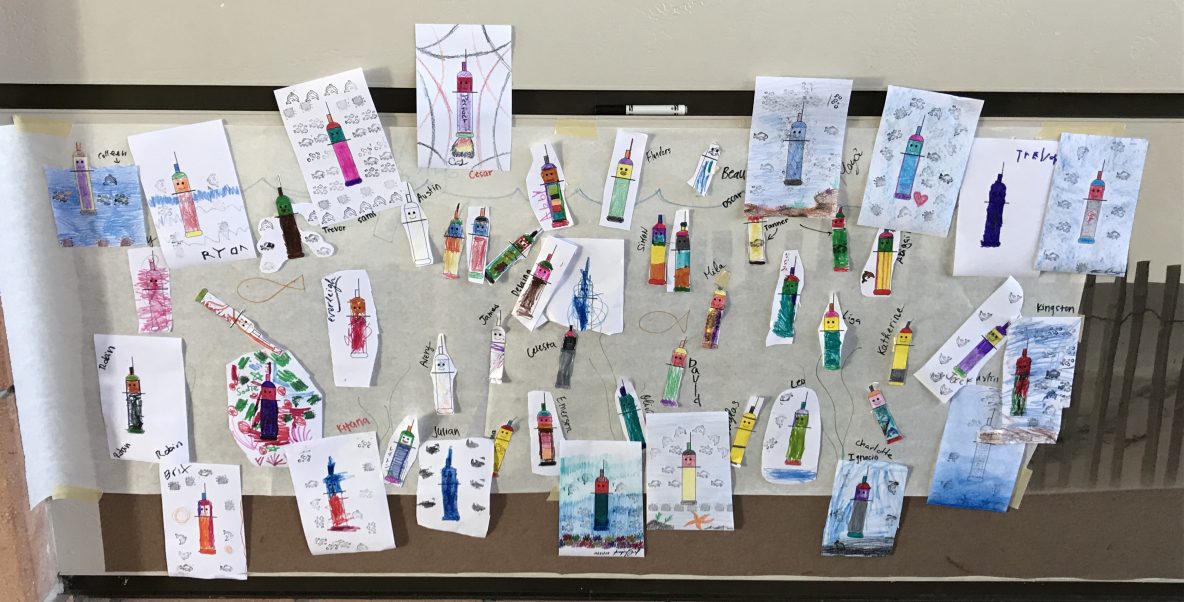
The first is a fairly classic approach of developing educational material for classroom use. The target audience for this category is large, encompassing students of all ages (kindergarten through university level). The goal is to have material for all levels. Some materials need computers and internet access, while others do not. Thus, all teachers, no matter their resources, can use Argo data in their classroom.
The second approach taken is outreach workshops. These workshops target the scientific community. Scientists who want to learn more about how to obtain, map, and analyze Argo data are invited to participate. Workshops are organized by groups associated with Argo to address the differing needs generated by the multitude of users around the world. Talks prepared by scientists for some of these outreach workshops are available here.
A third approach consists of developing user-friendly online resources, such as in Earth.nullschool.net and animations or short programs about Argo, which allow the public, in general, to educate themselves about Argo. These resources differ from the educational materials for classroom use in that they do not provide actual curricula, but they can provide tools to create material to teach others about Argo.
| Curriculum | Description | Target Audience | Themes |
| Argo Online School | This website is a series of videos, animations and Jupyter Notebooks designed to be accessible for high school and higher education. | High school through graduate school | The Argo Program and how to use Argo data |
| Carole Brieseman’s (NZ educator) webiste | The website features easy to understand explanations of Argo floats, how they work and what they measure. There are science experiments, reading and writing activities and short videos on a variety of topics. | K – 12 | Density, currents, float technological advancements |
| LEARNZ field trip on the R/V Tangaroa | Join scientists from New Zealand, Australia and the US as Deep Argo prototype floats are deployed as well as core Argo floats. Read about and watch interviews with scientists aboard the ship to learn about ocean observations and Argo. Find curriculum related to science, technology, social science, and writing. | Grades 1 – 5 | Ocean observation, ocean currents, relationship between humans and the environment |
| EuroArgo website | The EuroArgo website contains information on how floats work, how to interpret Argo profile data and gives reasons for why Argo data are needed. There are some quizzes and activities, but the page is undergoing updates currently, so it may not all be available. | Grades K – 6 | Density, currents |
| MBARI’s EARTH Lesson Plans | EARTH Lesson Plans are designed by educators, for educators. Each lesson plan was created as part of an EARTH workshop where educators worked directly with scientists to understand and integrate their data sets into the lessons. Hurricane Detectives looks at chlorophyll-a from BGC floats, Taking a Dip in the Ocean Data Pool introduces float data and more. | Grades 6 – 12 | Ocean observations, chlorophyll-a, hurricanes and ocean properties |
| Mon Océan et moi website | Mon ocean et moi (My Ocean and Me) & Adopt a Float are France-based educational projects designed specifically to raise students awareness of ocean science and help students follow floats in the ocean. Explore the interactive map showing BGC Argo float locations and figures of BGC Argo data. There are also activities, games, puzzles and more. | Grades 6 – 12 | Ocean observations, marine phytoplankton, marine zooplankton, ocean seasons and ocean properties |
| SEREAD | SEREAD (Scientific Educational Resources and Experience Associated with the Deployment of Argo profiling floats in the South Pacific Ocean) is an educational program and resource that provides regionally relevant and focused ocean science that is built upon Argo data in a format that fits into existing curricula of Pacific Island schools. SEREAD teaches basic scientific fundamentals in a hands-on approach using examples that build on Pacific students’ everyday observations and experiences. The program facilitates interactions and discussions between today’s ocean and climate scientists, teachers and students, and tomorrow’s leaders on the important connections between the ocean, land and climate of the Pacific Island Region. | Grades 3 – 12 | Weather, climate, rising sea level |
| SOCCOM Educational Resources | SOCCOM, a US program that deploys biogeochemical Argo floats in the Southern Ocean, has developed multimedia learning modules on the science and technology of SOCCOM. The modules feature handouts plus resources like video clips, animations, slides, photos, and links to blogs by SOCCOM researchers in the field. | Grades 6 – 12 | How floats work, carbon cycle, Southern Ocean’s role in Earth’s climate |
| Outreach workshop | Description | Target Audience | Topics |
| PICES Summer School in 2014 | Howard Freeland spoke at the PICES Summer School and gave two talks on Argo. The first was an introduction to Argo and the second was on how to access Argo data using the Global Marine Argo Atlas. | Undergraduate through graduate | Argo program, float technology and development, AMOC, ocean modeling and prediction |
| Online Resources | Description | Target Audience | Topics |
| Animations and short programs | Watch animations on how Argo floats work, why we need them and where floats move over time in the ocean. There are several short programs featuring topics like Argo vs. Deep Argo, a float lab tour and float development. | Primary through graduate | Float technology and development, core Argo, Deep Argo |
| Argovis | Visualize temperature, salinity, and BGC data by location at argovis.colorado.edu or access data via an API. View float trajectory forecasts, compare gridded fields with Argovis’ grid visualization module or co-locate Argo data with Atmospheric Rivers. Stay tuned for additional modules using satellite and other Earth science datasets. See the Argovis GitHub page for help accessing the API via Jupyter Notebooks. | Undergraduate and graduate students | Global data visualization and access |
| Global Marine Argo Atlas | The Global Marine Argo Atlas makes it easy for users to look at Argo data and compare it to other global data sets in one free program. The Atlas, made to view gridded netCDF datasets, particularly Argo, Reynolds SST and Aviso altimetry, comes with the data already included and can be updated quarterly to receive new data as it becomes available. Note: the Atlas must be downloaded and the large dataset takes up a few GBs. The Windows version uses an old version of the graphing program and no longer has full capability for some difficult computations. Please consider Argovis’s gridded module instead. | Secondary, undergraduate and graduate students | Global data visualization |
| Earth.nullschool.net | If you want to see how ocean currents move in real time across the globe, check out Earth Null School. Used by classrooms to study weather and climate, this data viz site now has a beta version of Argo data available at this link. Note: this is a beta version with limited Argo data. | Primary and secondary | Global data visualization |
| Argo Google Earth Layer | Monitor the Argo network in real-time using Google Earth software (GE). This Argo layer for Google Earth shows the positions of all active and inactive floats, features stories about a select number of floats and shows where floats will be deployed. Includes data figures produced by Ifremer and shown on several other visualizations. Note: it is no longer well supported. Please consider Argovis, EuroArgo Dashboard or OceanOPS instead. | Primary through graduate | Global data visualization and access |
| Argo in Wikipedia | Background information on Argo that is similar to content on this site. This page is not regularly updated. | Primary, secondary | Information on Argo |

